脑未来科普 | 花儿为什么这样红
|
|
40年前,商务印书馆编辑贾祖璋老先生写下了《花儿为什么这样红》这一经典科普之作,被编入我们的语文教材,通过物理学原理和进化论的观点向我们解释了花儿是如何反射出不同波长的光线,从而呈现出这种“热情的色彩”。那么我们人类,为何能够体会到花儿的鲜艳呢?让我们跟随一束光线来一探究竟。 |


光照下的红花(图片来源网络)
首先,一束包含着不同频率光波的太阳光照射到了花朵上,由于花青素对不同酸碱度的反应,吸收了光波中大部分频率的光线,只留下红色波长的光线漫反射出去。其中,恰好有一束光线,进入了你的眼睛,在穿过晶状体和玻璃体后,落在了眼球最里面的内层结构——视网膜上。
就在这里,视网膜完成了光信号到电信号的转换,将光线的全部信息,以一种可以被“理解”的方式,发送给了大脑。
视网膜的结构
让我们将视网膜放大再放大,我们可以发现,视网膜是由三层细胞组成的:第一层是由视锥细胞和视杆细胞组成,统称光感受器(photoreceptors);第二层为双极细胞(bipolar cells),通过自己的两臂连接前后两层;第三层为节细胞(ganglion cells),节细胞的轴突沿视神经(第二对脑神经)行走,将视觉信息传入大脑。
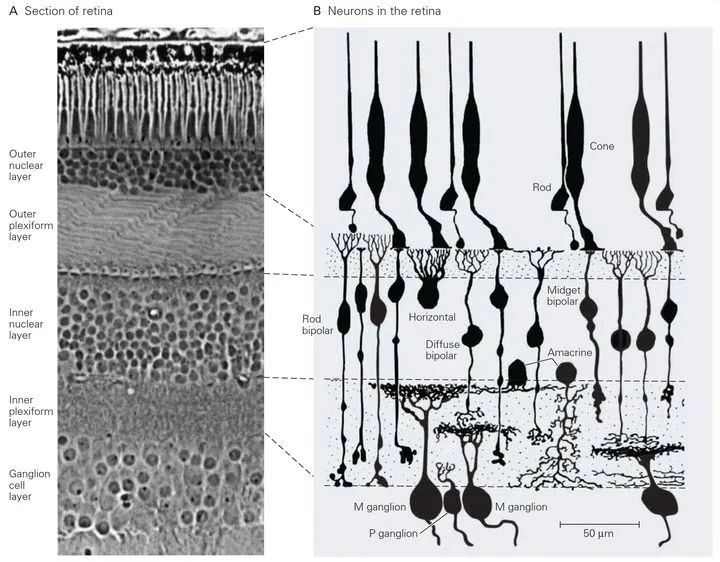
图一 视网膜神经回路示例(图片来源网络)
光感受器:三原色编码
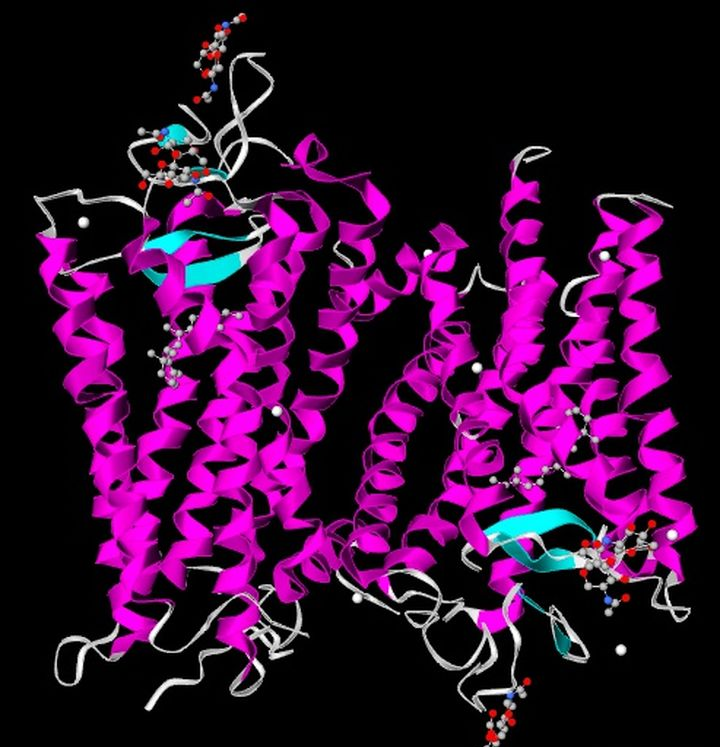
图二 视紫红质(图片来源网络)
经测定,三种视锥细胞的最大吸收峰分别位于420纳米(蓝-紫)、530纳米(绿)和560纳米(黄-绿)处(如图)。为求方便,人们通常将它们分别称为“蓝”、“绿”、“红”视锥细胞。

图三 视杆细胞和视锥细胞对光的吸收(从左到右依次为蓝视锥、视杆、绿视锥、红视锥细胞的吸收波长)
他们的视网膜上并不缺乏“红”、“绿”视锥细胞,只是对于红色盲而言,“红”视锥细胞中填充的是“绿”视锥细胞的视蛋白,而绿色盲恰好相反。相同的是二者均不能区分红色与绿色,他们眼中的世界笼罩在黄色和蓝色之中。

图四 蓝色盲眼中的世界(摄影师Davide Sasso作品)
节细胞:对立加工编码
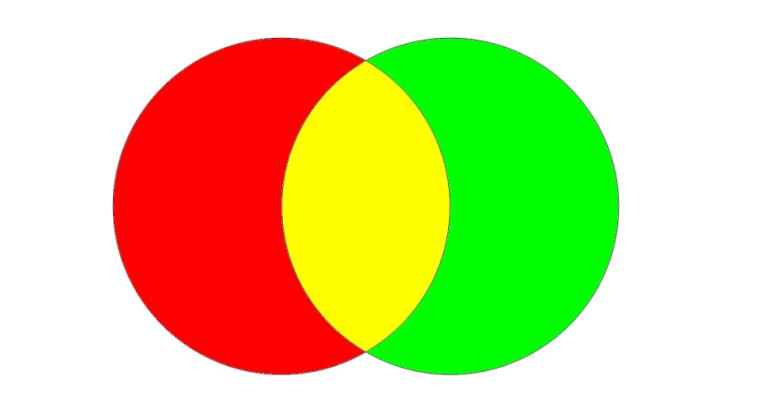
图五 红(#FF0000)和绿(#00FF00)的混合色为黄色(#FFFF00)既不接近红色也不接近绿色
想要看到一个红中带绿的色调,除非红-绿节细胞同时兴奋和抑制,而这永远不会发生。正因为这些精细的视觉神经调控系统,才让我们眼中的世界五彩斑斓。
参考文献
[1] Carlson N R. Foundations of behavioral neuroscience[M].Pearson Education, 2013.
[2] Jacobs, G. H. Primate photopigments and primate colorvision. Proceedings of the National Academy of Sciences, USA, 1996, 93, 577–581.
摘要原文(Abstract):
The past 15 years have brought much progress in ourunderstanding of several basic features of primate color vision. There has beenparticular success in cataloging the spectral properties of the conephotopigments found in retinas of a number of primate species and inelucidating the relationship between cone opsin genes and their photopigmentproducts. Direct studies of color vision show that there are several modalpatterns of color vision among groupings of primates: (i) Old World monkeys,apes, and humans all enjoy trichromatic color vision, although the former twogroups do not seem prone to the polymorphic variations in color vision that arecharacteristic of people; (ii) most species of New World monkeys are highlypolymorphic, with individual animals having any of several types of dichromaticor trichromatic color vision; (iii) less is known about color vision inprosimians, but evidence suggests that at least some diurnal species havedichromatic color vision; and (iv) some nocturnal primates may lack colorvision completely. In many cases the photopigments and photopigment gene arrangementsunderlying these patterns have been revealed and, as a result, hints areemerging about the evolution of color vision among the primates.
[3] Hunt, D. M., Dulai, K. S., Cowing, J. A., Julliot, C.,et al. Molecular evolution of trichromacy in primates. Vision Research,1998, 38, 3299–3306.
摘要原文(Abstract):
Although trichromacy in Old and New World primates is basedon three visual pigments with spectral peaks in the violet (SW, shortwave),green (MW, middlewave) and yellow–green(LW, longwave) regions of the spectrum, the underlying genetic mechanismsdiffer. The SW pigment is encoded in both cases by an autosomal gene and, inOld World primates, the MW and LW pigments by separate genes on the Xchromosome. In contrast, there is a single polymorphic X-linked gene in mostNew World primates with three alleles coding for spectrally distinct pigments.The one reported exception to this rule is the New World howler monkey thatfollows the Old World system of separate LW and MW genes. A comparison of genesequences in these different genetic systems indicates that the duplicationthat gave rise to the separate MW and LW genes of Old World primates is moreancient than that in the howler monkey. In addition, the amino acid sequencesof the two howler monkey pigments show similarities to the pigments encoded bythe polymorphic gene of other New World primates. It would appear thereforethat the howler monkey gene duplication arose after the split between New andOld World primates and was generated by an unequal crossover that placed twodifferent forms of the New World polymorphic gene on to a single chromosome. Incontrast, the lack of identity at variable sites within the New and Old Worldsystems argues for the origin of the separate genes in Old World primates bythe duplication of a single form of the gene followed by divergence to givespectrally distinct LW and MW pigments. In contrast, the similarity in aminoacid variation across the tri-allelic system of New World primates indicatesthat this polymorphism had a single origin in New World primates. A strikingfeature of all these pigments is the use of a common set of substitutions atthree amino acid sites to achieve the spectral shift from MW at around 530 nmto LW at around 560 nm. The separate origin of the trichromacy in New and OldWorld primates would indicate that the selection of these three sites is theresult of convergent evolution, perhaps as a consequence of visual adaptationin both cases to foraging for yellow and orange fruits against a green foliage.© 1998 Elsevier Science Ltd. All rights reserved.
[4] Boynton, R. M. Human Color Vision. New York: Holt,Rinehart and Winston, 1979.
[5] Wissinger, B., and Sharpe, L. T. New aspects of an oldtheme: The genetic basis of human color vision. American Journal of HumanGenetics, 1998, 63,1257–1262.
摘要原文(Abstract):
Most of the readers of this journal can perceive the fullrange of colors in the visible spectrum and, thus, are able to discriminateamong the color-coded bases of the DNA graphic on the cover and enjoy theintrinsic beauty of multicolor FISH micrographs and the brightness ofdye-labeled sequencing fragments on the screen of an automatic DNA sequencer.We appreciate the palette of impressionist painters, and we deal freely withyellow submarines, green traffic lights, and red emergency buttons. Vision isthe dominant sense in humans, and for most of us life is color coded. Colorvision and its deficiencies are long-standing concerns of human geneticists,but it was only with the molecular characterization of common forms ofcolorvision abnormalities (beginning in the late 1980s) that mechanisms emergedto explain well-documented clinical findings. Now, new questions have arisenabout the evolution and structural variability of the pigment genes and theregulation of their expression. In recent studies, the identification ofmutations in the gene that encodes a cGMP-gated cation channel has resolved themolecular basis of complete color blindness, thereby extending our knowledge ofcolor vision and revealing significant analogies among some very differentsensory signal transduction systems.
[6] Nathans, J. The evolution and physiology of human colorvision: Insights from molecular genetic studies of visual pigments. Neuron,1999, 24, 299–312
摘要原文(Abstract):
Color vision is the process by which an organism extractsinformation regarding the wavelength composition of a visual stimulus (Figure1). In its simplest form—exemplified by the wavelength-dependentphototactic responses of halobacteria—color vision isbased on the relative abundances of two isoforms of a sensory pigment (Hoff etal., 1997). One isoform preferentially absorbs long wavelength light andmediates a photoattractant response, and the second isoform preferentiallyabsorbs short wavelength light and mediates a photorepellant response. Lightabsorption photoconverts the first isoform into the second, and the second intothe first. Thus, the steady-state ratio of pigment isoforms provides a measureof the spectral composition of the ambient light.
The halobacterial system contains the two cardinal elementsof every color vision system: (1) two or more sensory pigments with differentspectral sensitivities (although in most organisms these are distinctchromoproteins rather than isoforms of a single chromoprotein), and (2) amechanism for monitoring the relative number of photons captured by thedifferent pigments. In higher eukaryotes, this system has evolved so that, ingeneral, each pigment resides within a distinct class of photoreceptor cells,and therefore the ratios of photoexcitation of the different pigments can bedetermined by assessing the ratios of activation of different photoreceptorcells.
[7] Daw, N. W. Colour-coded ganglion cells in the goldfishretina: Extension of their receptive fields by means of new stimuli. Journal ofPhysiology (London), 1968, 197, 567–592.
摘要原文(Abstract):
1. Receptive fields of colour-coded ganglion cells of thegoldfish retina were investigated.
2. Only a few cells (5%, Type P) were found to be as simpleas those described by Wagner, MacNichol & Wolbarsht (1960, 1963), with an ‘on’ response to red light in the centre, andan ‘off’ response to greenlight over a rather wider area, or vice versa.
3. Most cells (49%, Type O) also gave a peripheral responsewith an ‘on’ response togreen light, and an ‘off’response to red light in the periphery, as well as an ‘on’ response to red light and an ‘off’ response to green light in the centre (or vice versa).
4. When a small spot of light was used to stimulate theperiphery of a Type O cell, the peripheral response usually was not obtained.The organization of the periphery is such that a stimulus of large area and lowintensity (annulus) is much more effective than a stimulus having equal energywith small area and high intensity (spot). If only small spots are used, theType O cell is indistinguishable from the Type P cell.
5. Spectral sensitivity measurements show that one centraland one peripheral process are fed primarily by red-absorbing cones, and theother central and the other peripheral process by green-absorbing cones orrods.
6. The diameter of the receptive field as a whole is verylarge, being 5 mm or more on the retina.
7. When red spots in green surrounds, or red/greenboundaries are used as stimuli, the response can be predicted by summing theresponses to the components of the stimulus.
8. This type of receptive field organization is appropriateto mediate simultaneous colour contrast. The ‘opponentcolour’ organization previously reported is appropriatefor successive colour contrast, but not for simultaneous colour contrast.
9. The component of the response coming from thegreen-absorbing cones was masked or hidden by the component of the responsecoming from the red-absorbing cones in 14% of the units (Type Q units). Thecomponent from the green-absorbing cones was revealed by using a high intensityof stimulation, or by observing the response after bleaching pigment with anintense red light.
[8] Gouras, P. Identification of cone mechanisms in monkeyganglion cells. Journal of Physiology, 1968, 199,533–538.
摘要原文(Abstract):
1. Blue, green, and red sensitive cone mechanisms have beenstudied in two types of on-centre ganglion cells in the Rhesus monkey's retina.
2. One type of cell receives signals from both green and redsensitive cone mechanisms, both of which excite in the centre and inhibit inthe periphery of the cell's receptive field. These cells discharge transientlyto maintained stimuli of any wave-length and are called pha8ic.
3. The second type of cell receives excitatory signals fromonly one cone mechanism, either blue, green or red sensitive, in the centre,and inhibition from another cone mechanism in the periphery of its receptivefield. These cells discharge continuously to maintained stimuli of appropriatewave-length and are called tonic.
4. Tonic cells outnumber phasic cells although both arefound adjacent to one another throughout the retina. Phasic cells arerelatively more common toward the periphery and tonic cells relatively morecommon toward the fovea.
[9]. Dartnall H J A, Bowmaker J K, Mollon J D. Human visualpigments: microspectrophotometric results from the eyes of seven persons[J].Proceedings of the Royal society of London. Series B. Biological sciences,1983, 220(1218): 115-130.
摘要原文(Abstract):
The material for this work was obtained from seven eyesremoved because of malignant growths. Foveal and parafoveal samples of theretinas were taken and transverse measurements were made of the absorbancespectra of the outer segments of the rods and cones, using a Liebmanmicrospectrophotometer. Four kinds of spectra were obtained with absorbancepeaks at the following wavelengths: rods, 496.3 ± 2.3nm (n = 39); red cones, 558.4 ± 5.2 nm (n =58); green cones, 530.8 ± 3.5 nm (n = 45); bluecones, 419.0 ± 3.6 nm (n = 5). The distribution ofthe peaks was unimodal for the rods. For the red and green cones, however,there was evidence for bimodal distributions, with sub-population maxima at563.2 ± 3.1 nm (n = 27) and 554.2 ± 2.3 nm (n = 31) for the reds and at 533.7 ± 2.1 nm (n = 23) and 527.8 ± 1.8 nm(n = 22) for the greens. A substantial difference in mean spectrallocation of the red cones was observed between patient 1 (561 nm) and patient 4(553 nm). Both patients were classified as normal trichromats by all clinicaltests of colour vision but there was a clear difference in their relativesensitivities to long-wave fields. In both direction and magnitude, thisdifference proved to be that required by the microspectrophotometric results.
—— 作者介绍 ——
 |
冯 润 中国科学院大学,深圳先进技术研究院脑认知与脑疾病研究所 电子信息2020级硕士生 培养单位:中国科学院深圳先进技术研究院 导师:蔚鹏飞 副研究员 研究方向:计算神经行为学 |